Technical Analysis Charting
Conduct detailed chart analysis using this powerful TradingView tool and analyze the charts of your favorite tokens and coins using dozens of different technical indicators. Search for your favorite coins and tokens by clicking in the upper left corner (box with the symbol/trading pair) and search for the pair you want to analyze. You can also utilize the “Compare” feature to add additional tokens and coins to the same chart for a comparison of the indicators that you apply. Popular indicators are listed below the chart with a brief description of their use.
Due to the size of the chart, this feature is best utilized with desktops and tablets.
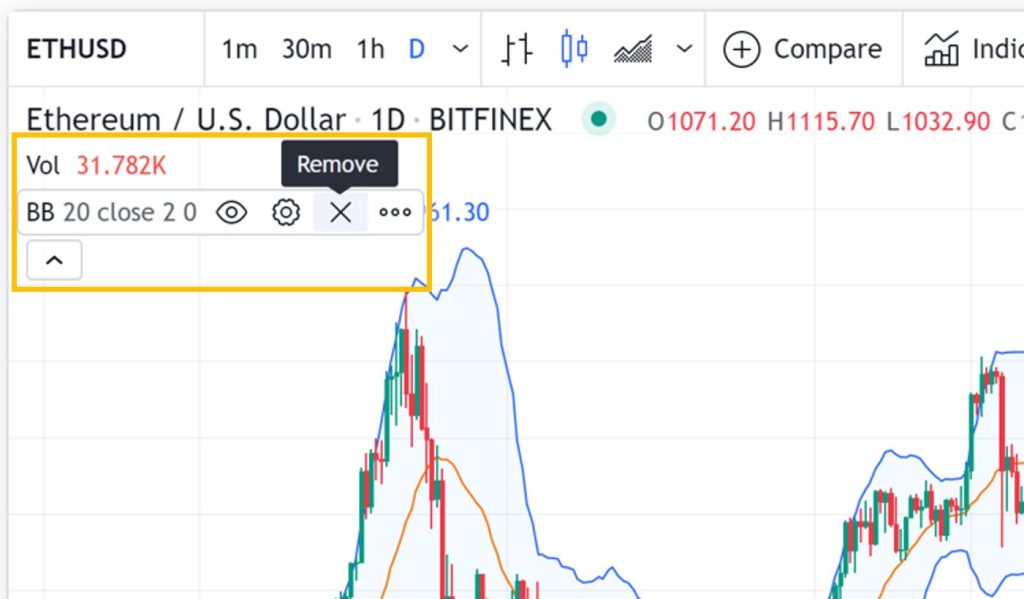
Removing individual Indicators: To remove indicators that you add to your chart, simply click the “X” that appears in the upper left corner of the chart just below the coin or token name. Some indicators may be added to box below the chart (such as volume indicators), and those can be removed using the same feature in the box where the indicator appears.
Removing all indicators: Refreshing your browser page will clear all indicators and will return the chart to the default view (Eth/USD).
Settings: You can adjust the settings of the indicators by selecting the Gear Icon shown on each indicator.
Confirming Trading Pairs: Trading Pairs can be confirmed with a quick check on DEXTools. Click on this link or on the Dextools logo to confirm the trading pair address being used during your charting analysis.
Bollinger bands are a volatility indicator. They consist of a simple moving average, and 2 lines plotted at 2 standard deviations on either side of the central moving average line. The outer lines make up the band.
Ichimoku Cloud is a collection of lines plotted on the chart. It’s an indicator that measures future price momentum and determines areas of future support and resistance.
Relative Strength Index (RSI) is a momentum indicator plotted on a separate scale. There’s a single line scaled from 0 to 100 that identifies overbought and oversold conditions in the market. Readings over 70 indicate an overbought market, and readings below 30 indicate an oversold market.
Moving Average Convergence Divergence (MACD) is a trend indicator that consists of a fast line, a slow line, and a histogram. When a new trend is forming, the MACD lines will converge and crossing lines indicate that a trend has reversed.
Parabolic Stop and Reverse (Parabolic SAR) is a trend indicator. Dots are placed on the chart above or below the price, and they indicate the potential direction of the price movement.
Stochastic is a momentum indicator that can be used to find where a trend might be ending. Similar to RSI, this can be used to determine when an asset is overbought or oversold.
Average Directional Index (ADX) is a trend indicator that ranges from 0 to 100 to indicate trend strength.
Moving Average (Simple, or SMA) is used to identify the direction of a current price trend without the interference of shorter-term price spikes.
Exponential Moving Average (EMA) is another form of moving average. Unlike the SMA, it places a greater weight on recent data points and captures new information, helping to identify significant moves. The most popular exponential moving averages are 12- and 26-day EMAs for short-term averages, whereas the 50- and 200-day EMAs are used as long-term trend indicators.